
Cloud kitchens in the United States typically earn a net profit margin of 8% to 15%, depending on order volume, food cost control, and how much revenue flows through third-party delivery platforms versus owned channels. Its contribution margins run between 18% and 25%, while a well-run single-location operation processing around 2,000 orders per month at a $30 average order value can generate $60,000 in monthly revenue or net roughly $7,200 after all expenses.
That range is real, but it belongs to operators who understand the cost structure cold.
Needless to mention, a cloud kitchen business model does present genuine advantages:
- Lower overhead costs
- No front-of-house payroll
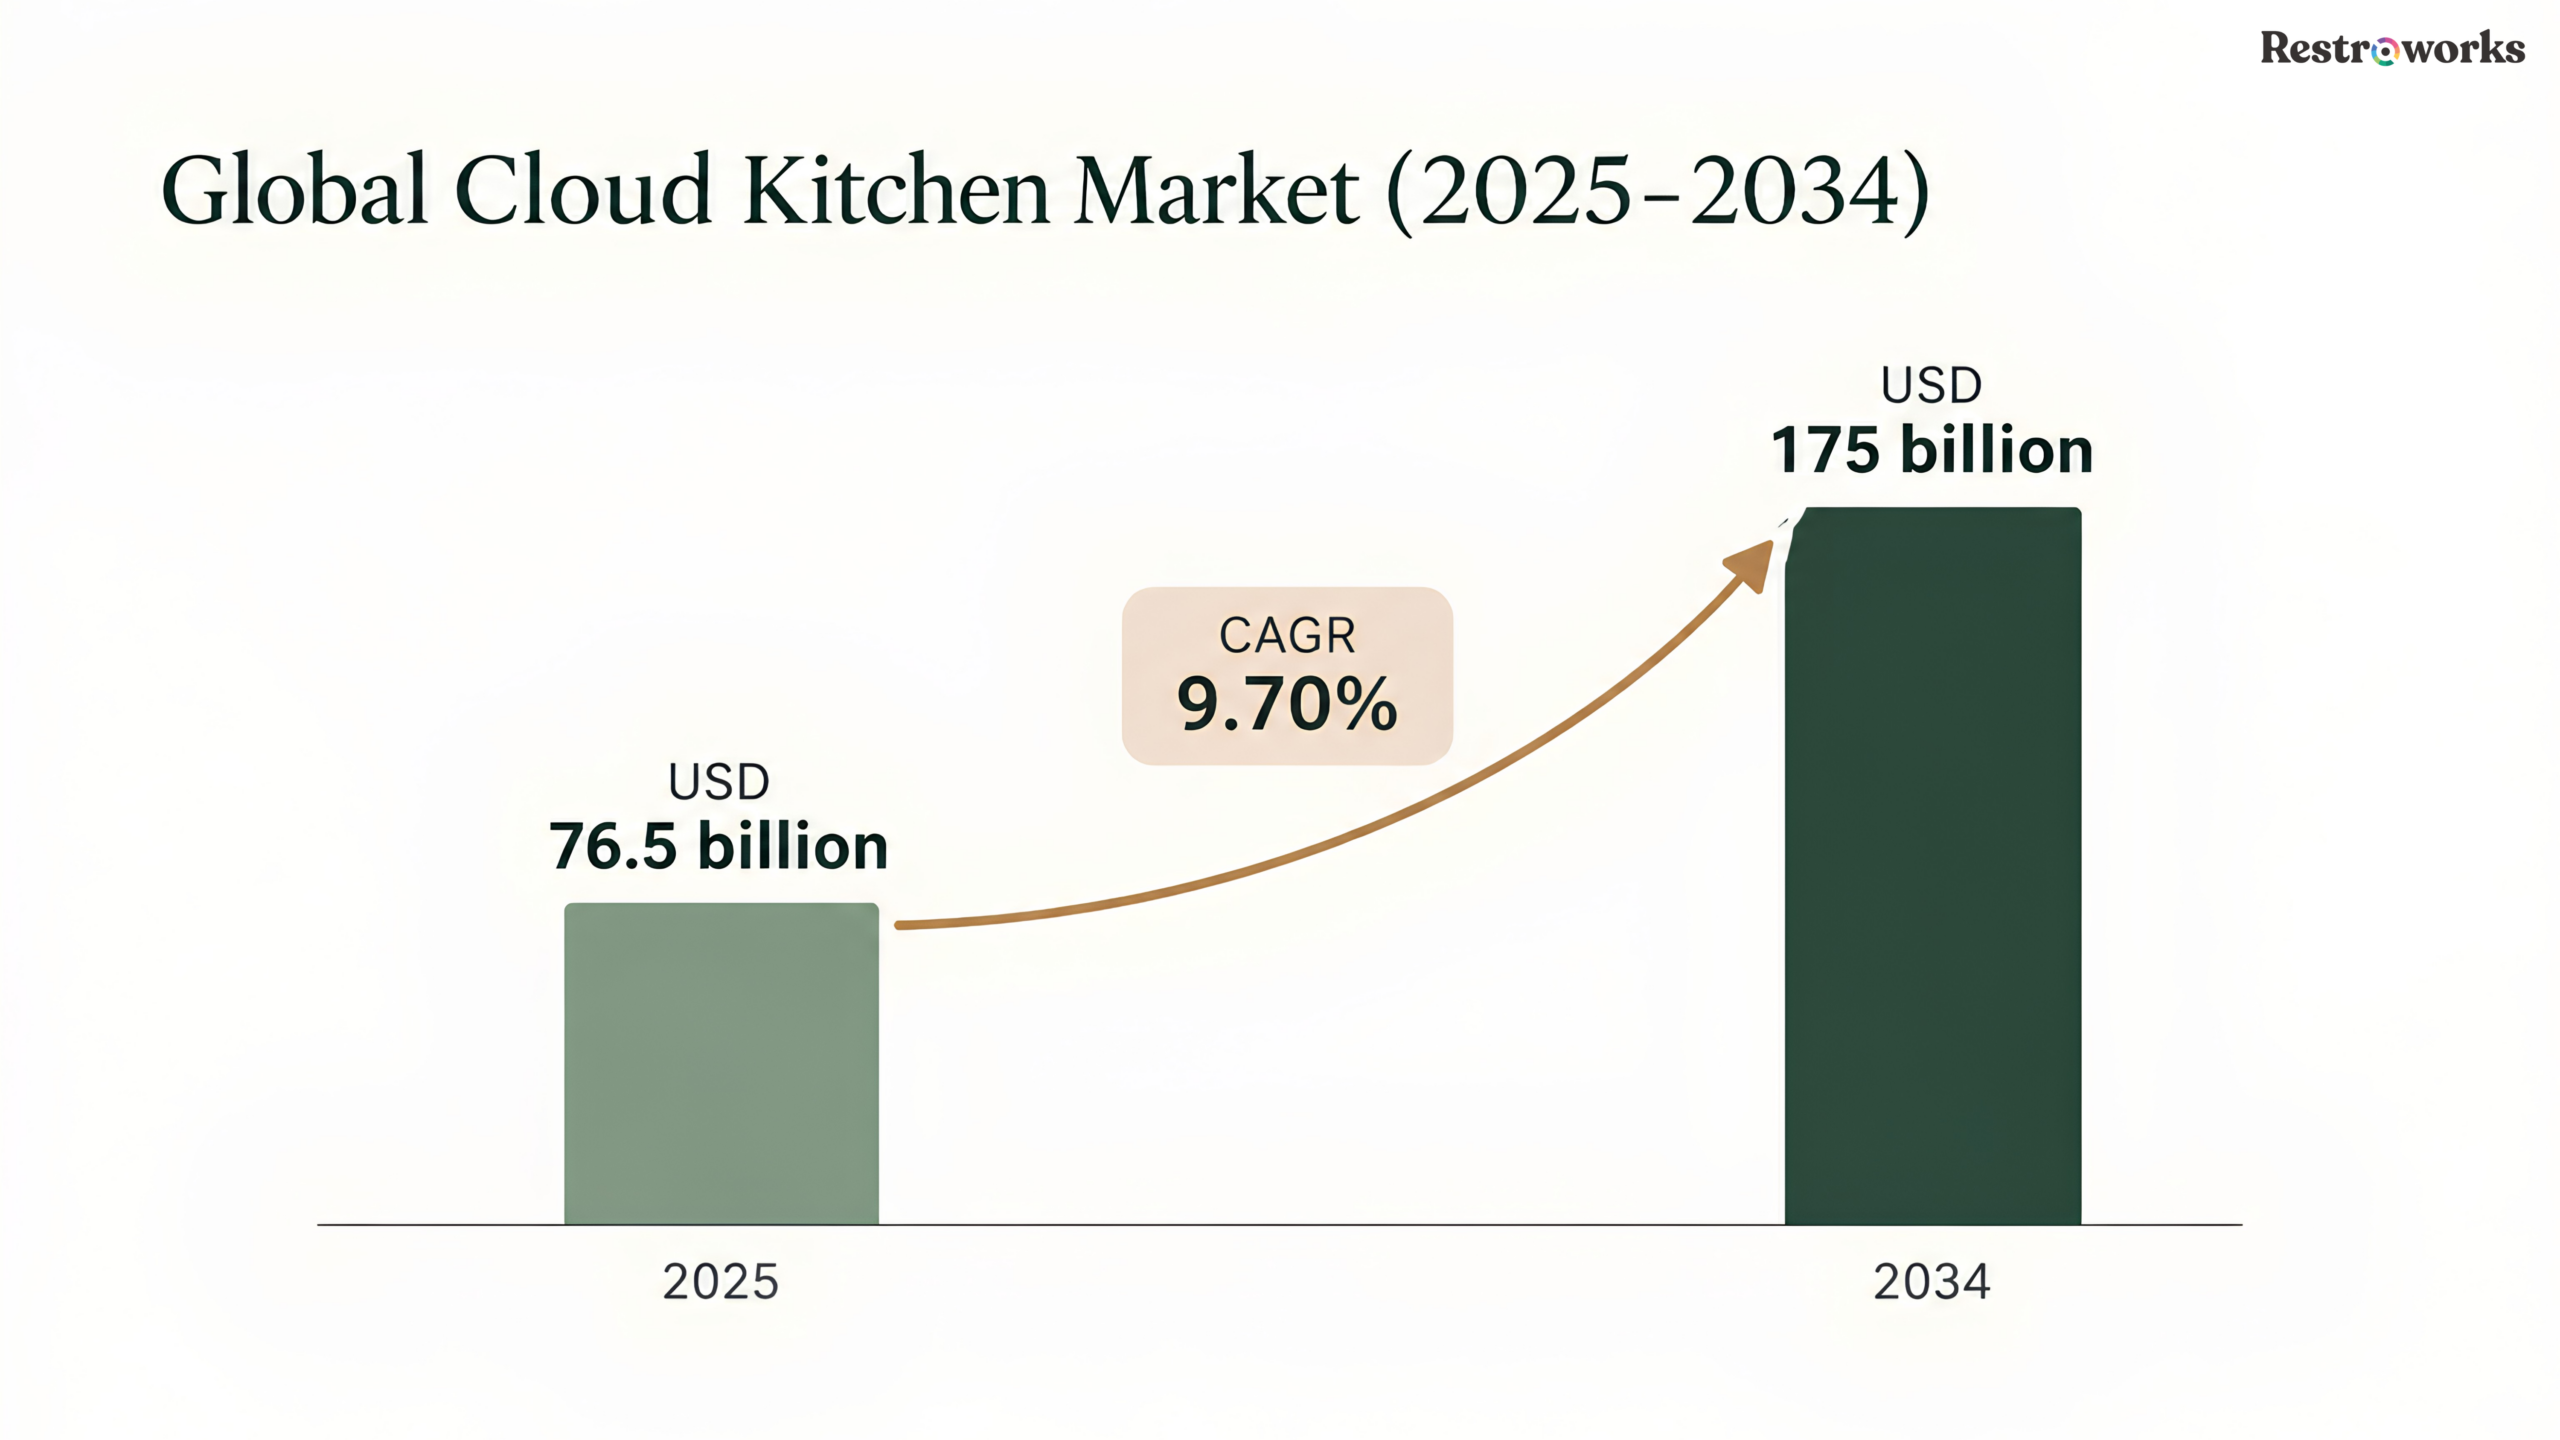
- A global cloud kitchen market valued at USD 76.5 billion in 2025, projected to reach USD 175 billion by 2034 at a CAGR of 9.70%, according to Fortune Business Insights.
But it also carries a $50,000 to $250,000 upfront investment and delivery platform commission rates of 15% to 30% that compress your margin fast.
What You’ll Learn
- The real profit margins and earnings for cloud kitchens.
- The seven levers that determine whether your cloud kitchen makes money.
- Actionable strategies to protect your cloud kitchen’s bottom line.
What Does a Cloud Kitchen Business Actually Earn?
A cloud kitchen (also known as a dark kitchen, ghost kitchen, or virtual kitchen) is a commercial kitchen space that prepares food solely for delivery and takeout, with no dine-in area or dining room. Operators like CloudKitchens and similar facility providers offer turnkey commercial kitchen spaces where the cloud kitchen concept eliminates front-of-house staff and street-facing lease premiums, which is where the cloud kitchen business model earns its margin advantage over the restaurant industry.
Monthly Revenue and Net Profit: A Worked Example
Here is what a single-location US cloud kitchen looks like at 2,000 orders per month with a $30 average order value, running a blended 25% delivery commission rate across platforms and owned channels:
Get all these right, or close to it, and your year-one earnings can reach what most restaurant owners do not see in five years. Start with the three High-risk levers first: contribution margin, order volume, and delivery channel mix. Those are the three you can influence in month one; the others require contracts and infrastructure that take longer to optimize.
What Major Expenses Should You Expect?
The cloud kitchen model offers genuinely lower overhead costs than traditional restaurants. But “lower” does not mean “low.” Below are the operating expenses that most early-stage cloud kitchen operations struggle with.
Food Costs and Food Waste
Food costs are your most controllable variable. While the target food cost percentage for a profitable cloud kitchen is around 28% to 35% of revenue, some highly optimized operations push this down to 14% through aggressive menu engineering and inventory management.
A lower food cost percentage directly translates to higher profit margins. Use a food cost calculator to benchmark your current position, then close the gap by actively tracking food waste, inventory, menu performance, proper storage conditions, and raw materials usage daily. Regularly reviewing food cost percentages and inventory reports helps with effective cost control.
A growing number of cloud kitchen operators now run their cloud kitchen operations on dedicated inventory management software. These tools track ingredient usage against historical sales data, predict demand through data-driven decision-making, and automate purchasing to reduce food waste and keep food cost percentages tighter.
Menu engineering matters here. When you build your menu around shared ingredients (proteins, sauces, and base components used across multiple dishes), your raw materials spend less time in cold storage and more time generating revenue. Streamlining the menu can also lead to operational efficiency and reduced food preparation time. That is how you optimize inventory management without adding headcount.
Labor Costs
Labor costs are typically 20% to 25% of revenue, one of the largest line items in a cloud kitchen’s cost structure. At $60,000 monthly revenue, labor is $12,000 per month, or $144,000 annually.
And because it is such a high cost, how efficiently you schedule and deploy your team on a given day can have a direct impact on profitability. High-performing cloud kitchens stagger shifts to match hourly order patterns, cross-train teams to move between stations, and use data analytics on order flow. Implementing automation technology and kitchen display systems can lower labor costs and streamline operations across the kitchen space. Cloud kitchen management platforms like Restroworks help operators coordinate multiple brands, aggregator integrations, and kitchen workflows from a single system.
This is particularly important because unlike traditional restaurants that may offset slow periods with walk-in foot traffic or event bookings, cloud kitchens are almost entirely dependent on digital order volume. Here, staffing needs can change sharply based on seasonal fluctuations, order frequency, preferred cuisine types, and peak hours. Operators who don’t anticipate these changes overstaff during slow windows and under-prepare during demand spikes.
The best defense is historical order data: use it to build a seasonal staffing model, negotiate flexible supplier contracts that allow volume adjustments, and plan menu rotations to align with seasonal demand. Cloud kitchens with multi-brand setups have an advantage here because they can activate or deactivate brands based on seasonal demand patterns without changing their kitchen footprint.
Utility Costs, Kitchen Space, and Hidden Expenses
Monthly fixed overhead for a US cloud kitchen runs between $7,500 and $14,000, covering commercial kitchen space rent, utility costs, base marketing efforts, and technology. Technology costs (POS systems, kitchen display systems, inventory management software, and aggregator tools) add $200 to $500 per month that rarely appears in profitability projections. Insurance and licensing for a delivery-only food business run $500 to $2,000 per month depending on jurisdiction.
The real pressure comes from what does not show up cleanly on a P&L. Waste management, equipment depreciation, food spoilage, and poor inventory control can shave off another 10% to 15% of profits through accumulation.
Does Location Change Your Cloud Kitchen Profit?
To illustrate how location shapes margins, consider two markets. A Nashville cloud kitchen operation needs roughly 62 orders per day at a $28 average ticket to break even, with $4,200 monthly rent and lower labor costs. The identical concept in San Francisco needs 127 orders per day at a $32 ticket, with $11,500 monthly rent and significantly higher wages, requiring roughly twice the daily volume to cover overhead even with higher average order values. These figures are illustrative estimates based on typical market conditions in each city.
High-density urban markets support higher average order values but carry steeper kitchen rental rates and more competition on delivery apps. Suburban markets offer lower overheads but require more marketing efforts to build consistent daily order volume through online food delivery.
For a first-time operator, the market decision comes before the menu decision. Pick a location where your rent-to-order-volume ratio supports break-even at 60 to 80 orders per day, not one that requires 130 daily orders just to cover the overhead.
How Cloud Kitchens Generate Revenue and Scale It
Revenue in a cloud kitchen business comes from three levers: order volume, average order value, and delivery channel mix. The first two determine your top line; the third determines how much of it you keep.
Order Volume and Delivery Channel Mix
The primary revenue engine in a cloud kitchen is online food delivery. At 60 to 80 orders per day with an average order value of $30 to $42, a cloud kitchen covers its fixed costs and begins generating meaningful net profit. At 140 daily orders (which is basically the Year 5 projection for most high-performing operations), those same fixed costs spread thin enough that every incremental order delivers substantially more to the bottom line.
Online food delivery and online ordering are not the same channel. Orders through owned platforms (your app, website, or direct online ordering link) carry zero commission. Orders through delivery apps carry 15% to 30% fees. Directing even 30% of volume to owned channels measurably improves monthly revenue retained.
The Average Order Value Problem
If average order value slips from $40 to $30, the daily order volume required to cover fixed costs rises from about 36 to about 49. The defense is menu engineering: design the menu so upsells, bundles, and complementary items make the $35 to $40 order the path of least resistance. Beverages and add-ons often carry 70% to 80% gross profit margins. A $5 cold drink costing $1 to make is the easiest margin in this food business.
Diversifying Beyond Delivery
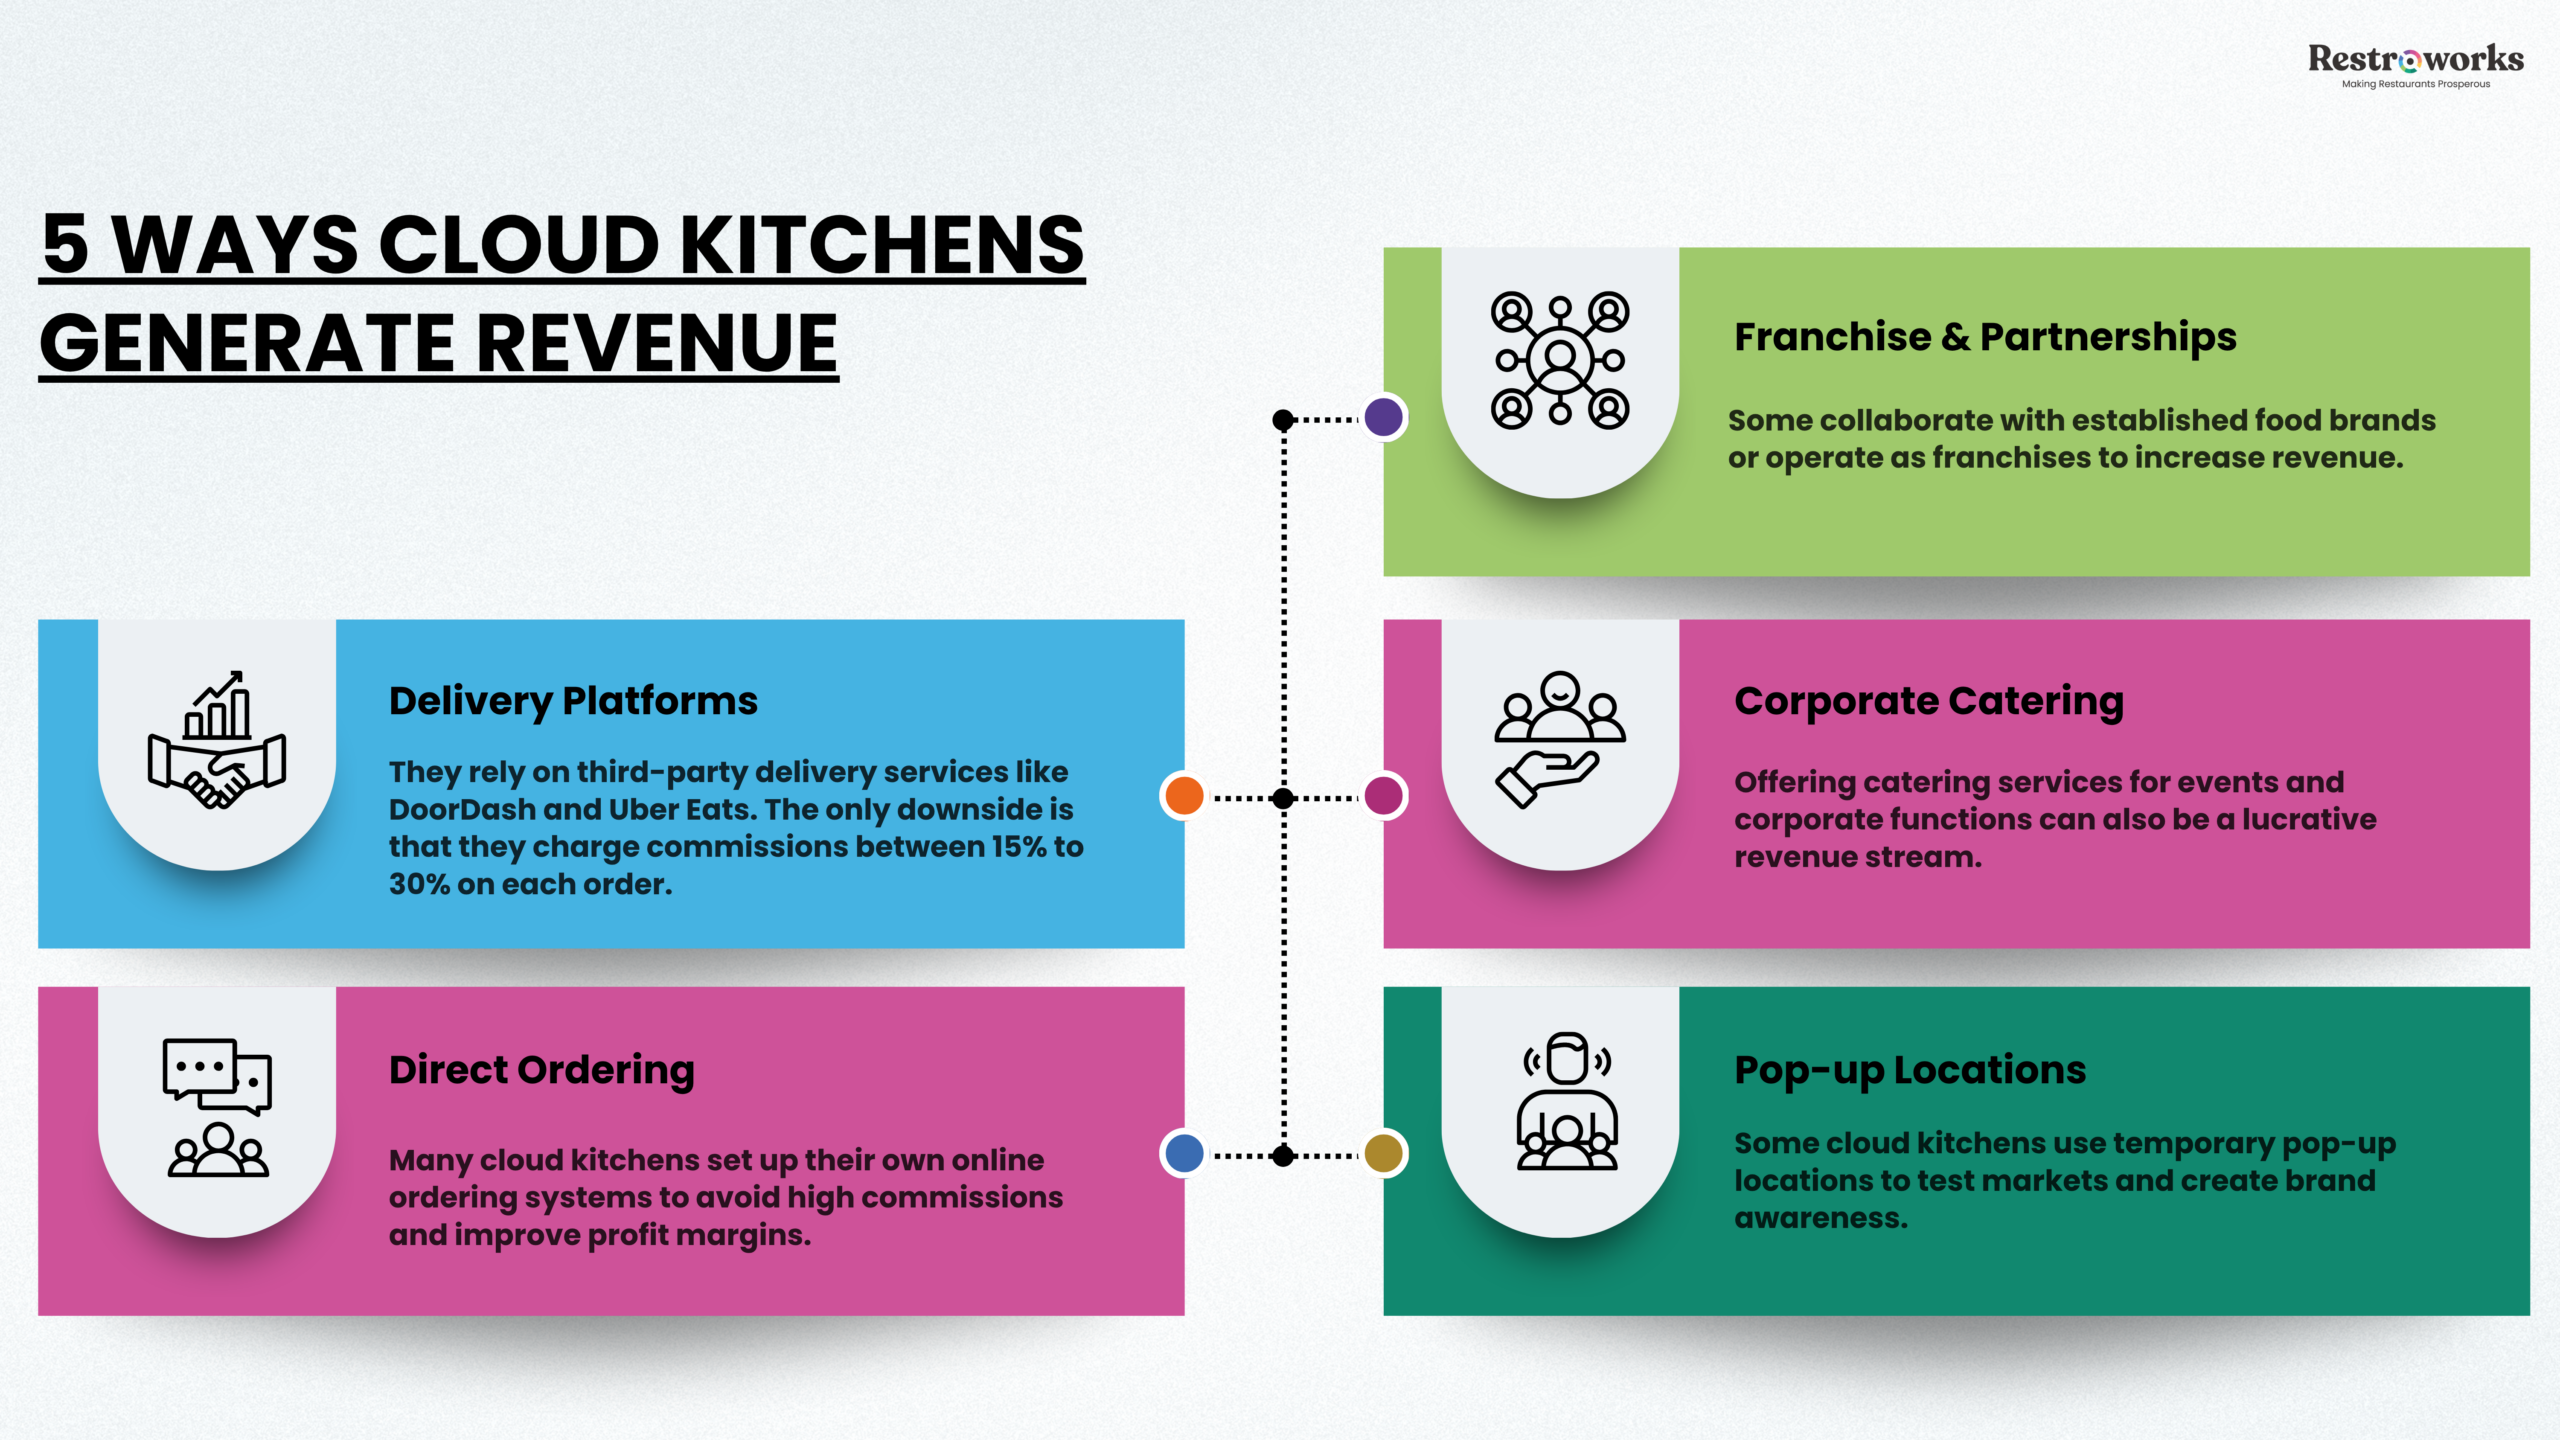
The most resilient cloud kitchen businesses diversify beyond food delivery orders. Catering services, subscription meal plans, and co-branded menu offerings can meaningfully increase total sales revenue while generating direct customer relationships outside a delivery app’s algorithm. Repeat customers ordering weekly through your owned channel are worth far more than one-time orders acquired through platform promotions.
Timeline to Profitability: What to Expect Month by Month
Most US cloud kitchens take 6 to 18 months to reach consistent profitability.
Why Most Cloud Kitchens Are Not Profitable in Month One
The first three to six months are an operational learning period: calibrating order patterns, ingredient usage, peak windows, and food preparation workflows. Here is a realistic timeline:
Months 1-3: Operating at a loss. Order volume between 30 and 50 per day. Menu testing, supplier negotiations, and delivery platform onboarding. Expect to burn $5,000 to $15,000 per month above revenue during this period.
Months 4-6: Approaching break-even. Order volume reaches 60 to 80 per day. Food costs begin stabilizing as menu engineering takes hold. Customer acquisition costs remain high as you build ratings and platform visibility.
Months 7-12: First consistent net profit. Order volume scales toward 100 per day. Repeat customers begin offsetting acquisition costs. The cloud kitchen business starts generating meaningful cash flow.
Month 12 and beyond: Operating leverage kicks in. Fixed costs remain flat while revenue grows. Operators who reach this stage with disciplined cost control and strong customer satisfaction ratings begin approaching the upper end of the 8% to 15% net margin range.
Operators who budget 18 to 24 months of financial runway before expecting consistent profitability survive. Those who plan for six months based on best-case projections often exhaust working capital before the cloud kitchen model stabilizes.
How Operational Efficiency and Food Quality Add to Your Profit Margins
In the cloud kitchen industry, you never see your customer. The only feedback loop is the rating on the delivery app. Ratings drive the algorithm, which drives visibility, which drives order volume. Everything connects.
Consistent food quality becomes a financial lever. An operation that delivers consistent food quality across every order retains customers, earns repeat orders, and builds a strong brand identity that generates organic growth without proportional marketing spend. Maintaining food quality during transit is equally critical. Insulated food containers at $0.30 to $0.50 per order preserve taste and temperature far better than standard packaging. The investment pays for itself: restaurants maintaining high ratings on delivery platforms like Uber Eats and DoorDash receive algorithmic priority placement that directly drives order volume.
Food safety is the floor. Cloud kitchen operations must meet the same health codes as any commercial kitchen, and waste management, temperature control, and food safety training protect every other line item in the P&L.
How Data Drives Cloud Kitchen Profitability
The structural advantage cloud kitchens hold over traditional restaurants is data access. Every order is digital. Every delivery is logged. Food delivery platforms return granular information on order times, popular menu offerings, peak windows, and customer preferences.
Cloud kitchen businesses that use data analytics to adjust food preparation schedules, refine menu offerings, and target marketing efforts by zip code and time of day gain a measurable productivity advantage over competitors.
Inventory management software that connects historical sales data to purchasing decisions is the most direct tool to reduce food waste, control food costs, and avoid over-ordering of raw materials.
Emerging food trends, flagged by food bloggers, delivery app data, and social media signals, feed into data-driven decision-making. The ability to test a new menu item, measure its performance within two weeks, and scale it or cut it without reprinting menus is a structural advantage the restaurant industry does not have.
How Can You Make Your Cloud Kitchen More Profitable?
Operators who systematically apply these strategies to their cloud kitchen business typically see the largest profitability gains in their first 12 months.
Optimize Menu Pricing and Reduce Food Costs
Menu engineering that highlights items with 70%+ contribution margins, combined with dynamic pricing during peak hours and negotiated supplier contracts, can substantially reduce food costs. For example, repricing a $12 rice bowl with a 75% contribution margin to $14 at a cloud kitchen processing 80 orders per day adds roughly $120 daily in retained revenue after platform fees without changing a single recipe.
Improve Operational Efficiency and Streamline Operations
Redesigning kitchen workflows to reduce food preparation time by 15% to 20% and integrating automation to lower labor costs can materially improve your net profit margin. The goal is more orders per labor hour, not more labor hours per order.
Build Owned Revenue Channels
Catering, meal kits, and subscription-based models bypass the 25% delivery platform commission. A cloud kitchen generating 70% of revenue through delivery apps and 30% through its own online ordering website and catering contracts retains roughly $4,000 more per month than one running 100% through aggregators on $60,000 in monthly revenue, even after accounting for payment processing fees on direct orders.
Invest in Marketing and Customer Retention
Budget $500 to $1,500 per month on social media advertising through platforms like Meta Ads and Google Ads. Invest in high-quality food photography, because in the online food ordering environment, visuals are your storefront. Build loyalty programs to increase repeat customer rates.
What No One Tells You About Cloud Kitchen Profit
The Profitability Valley
Cloud kitchen profitability analysis tends to present best-case variables simultaneously. In practice, operators have to balance food costs, labor, delivery commissions, packaging, and order volume. No way improving just one metric will improve the bottom line.
The consensus that higher order volume means higher profit also has a blind spot. Between 80 and 140 daily orders, many operators hit a profitability valley: volume is high enough to require additional labor shifts and larger ingredient orders, but not yet high enough to unlock commission negotiation leverage with delivery platforms. The margin per order can temporarily compress before operating leverage kicks in at higher volume. Mid-volume operations can be less profitable than either very small or very large ones.
The Calibration Year
The first year is calibration. You will learn your order patterns, ingredient usage, peak windows, and customer preferences. Revenue stability in a cloud kitchen is genuinely low early on because your order volume is effectively leased from aggregators. If a delivery app changes its algorithm, your visibility drops overnight. If it raises commissions, your margin compresses without warning.
The significant upfront investment of $50,000 to $250,000 for a US cloud kitchen should not be taken lightly. Every $100,000 in annual debt service drops your distribution potential by the same amount. An existing restaurant adding a virtual kitchen to its existing kitchen space has a structural advantage: lower initial investment, existing supplier relationships, and a customer base already familiar with the brand.
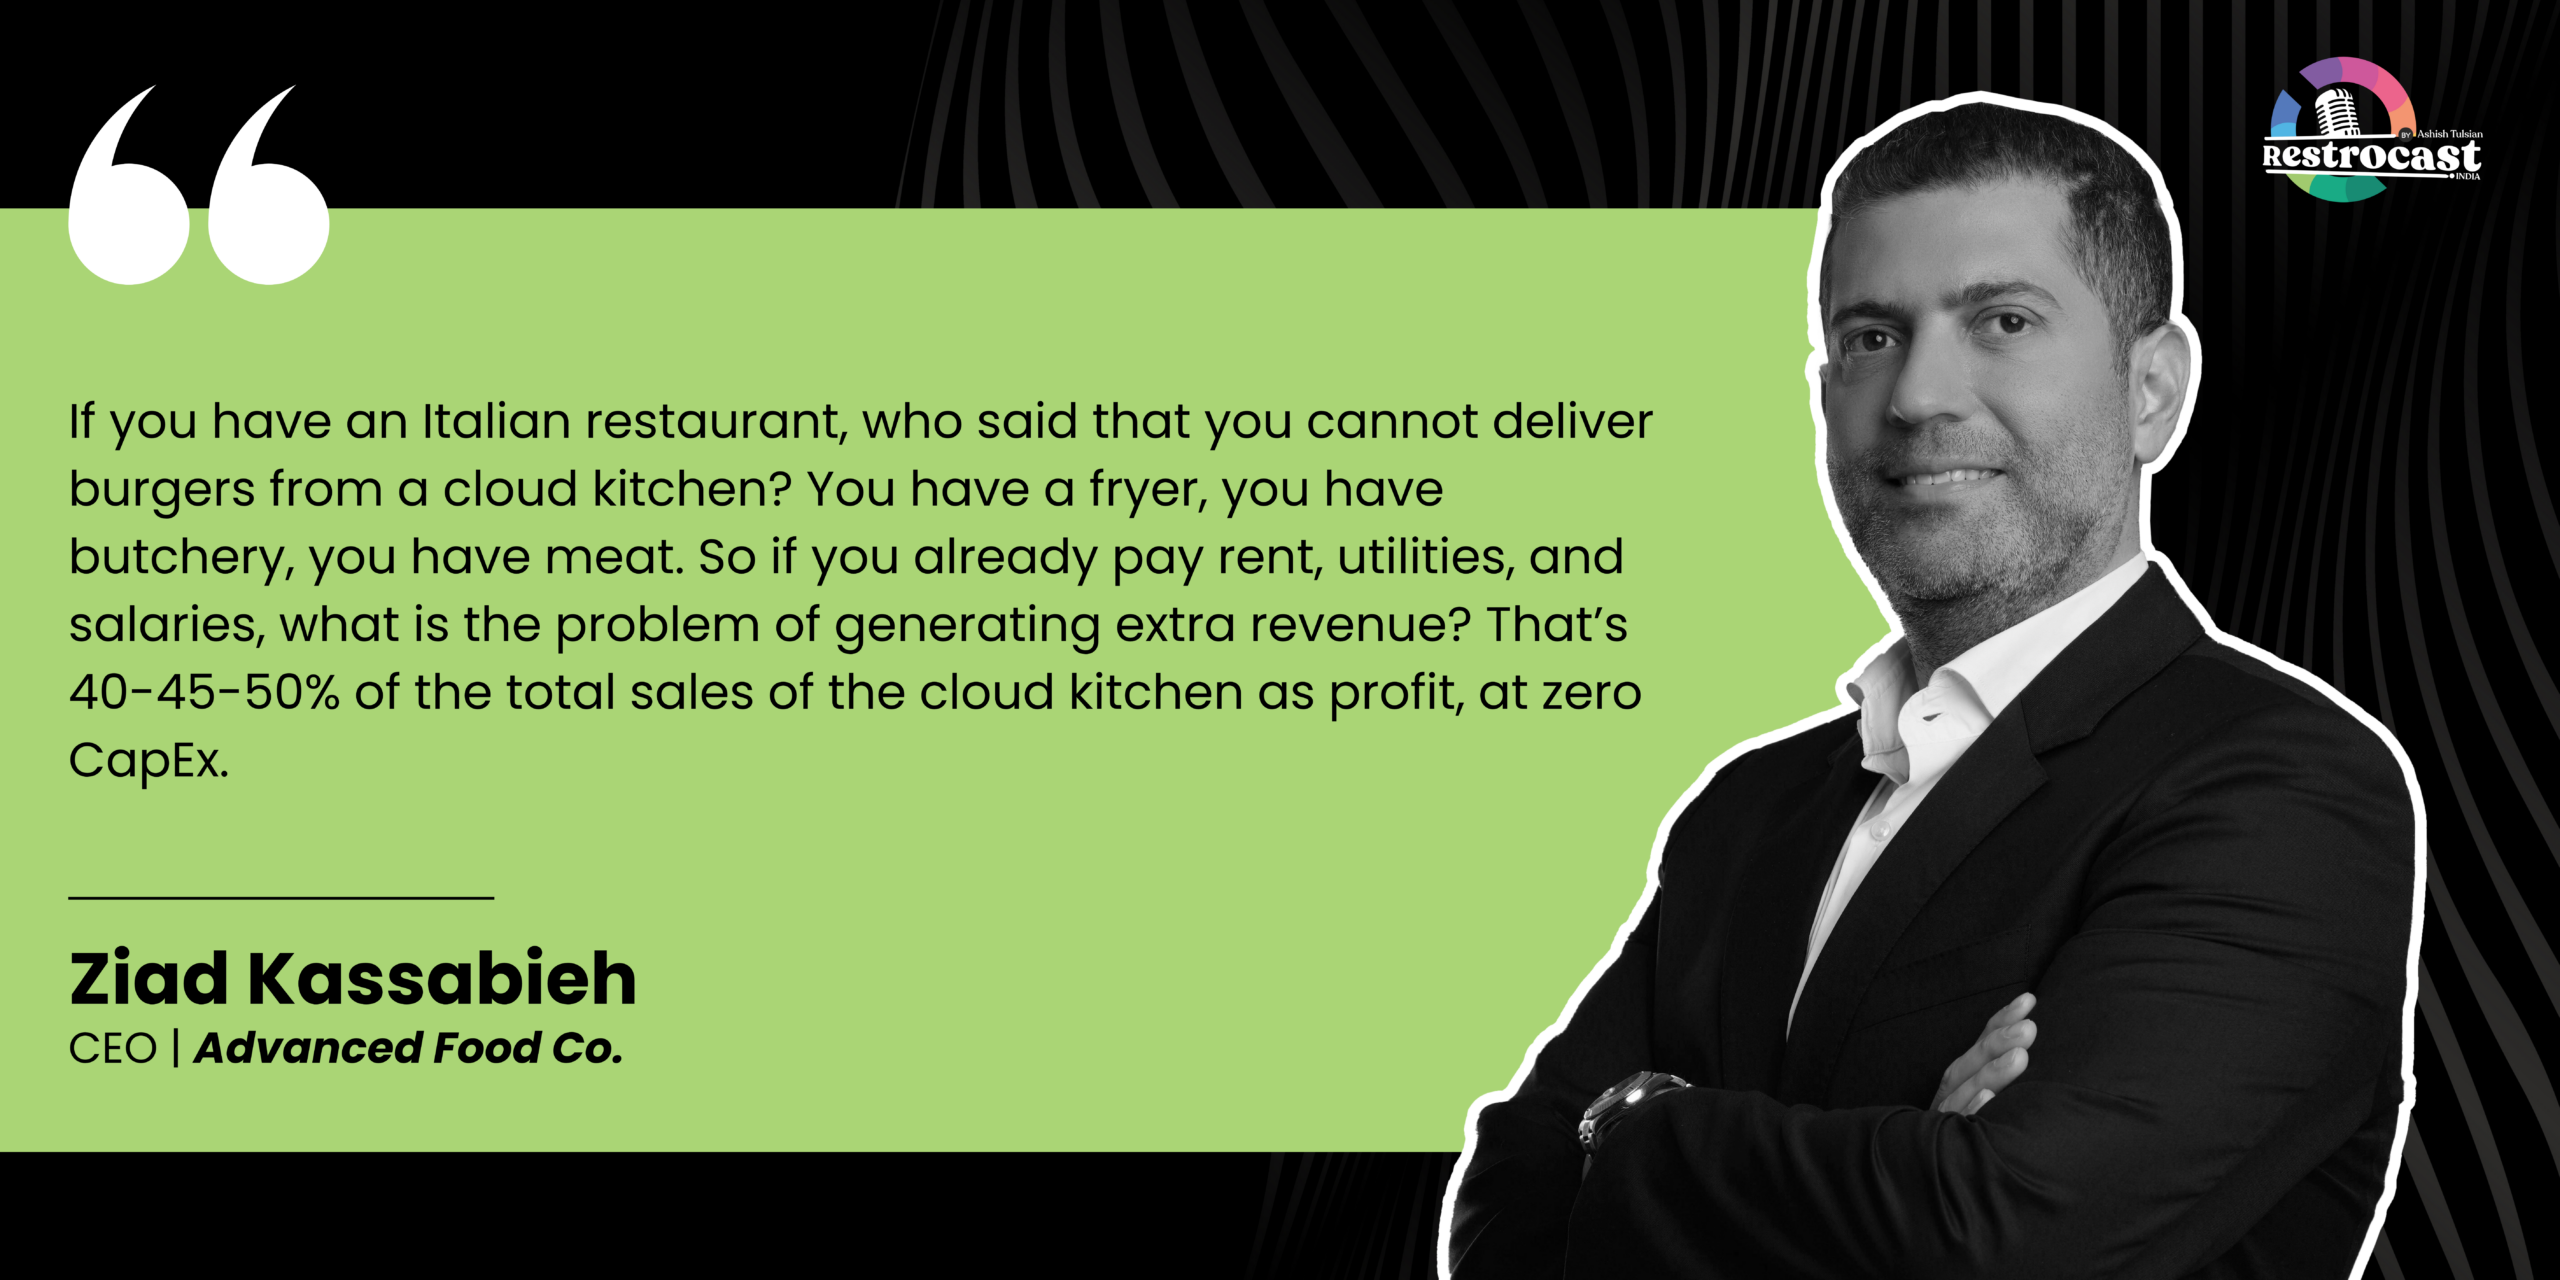
As Ziad Kassabieh, CEO of Advanced Food Company, who operates 15 cloud kitchens alongside his dine-in brands in Saudi Arabia, puts it:
The model works only for operators who understand the seven levers, protect the margin daily, and do not mistake a compelling pitch for a guaranteed outcome. The cloud kitchen business model is one of the most financially accessible entry points into the food industry. What you do with that access is the question only you can answer.
Listen: How to Scale Food Like Software — And Still Make Money